cinfo
cinfo is a command line tool for viewing the status of nodes in a Slurm cluster. It queries scontrol and presents the output as clean, colour-coded terminal tables.
cinfo replicates the behaviour of show_cluster but is generally faster as it is a compiled binary rather than an interpreted script.
Usage
cinfo [options]
By default, both the node table and the summary table are displayed. This mirrors the behaviour of show_cluster.
... and many more nodes, followed by a summary table...
Options
There are a number of options you can use with cinfo:
| Flag | Description |
|---|---|
-no-nodes | Hide the per-node information table |
-no-summary | Hide the cluster summary table |
-sort <field> | Sort the node table by a given field. Valid values: node, type, partition, cpu, memory, gpu, state |
-partition <name> | Filter view to show a specific partition |
-strudel | INTERNAL Print a JSON summary of GPU availability in the desktop partition (available and in-use counts per GPU type) |
-h|-help | Display a usage statement |
Running cinfo
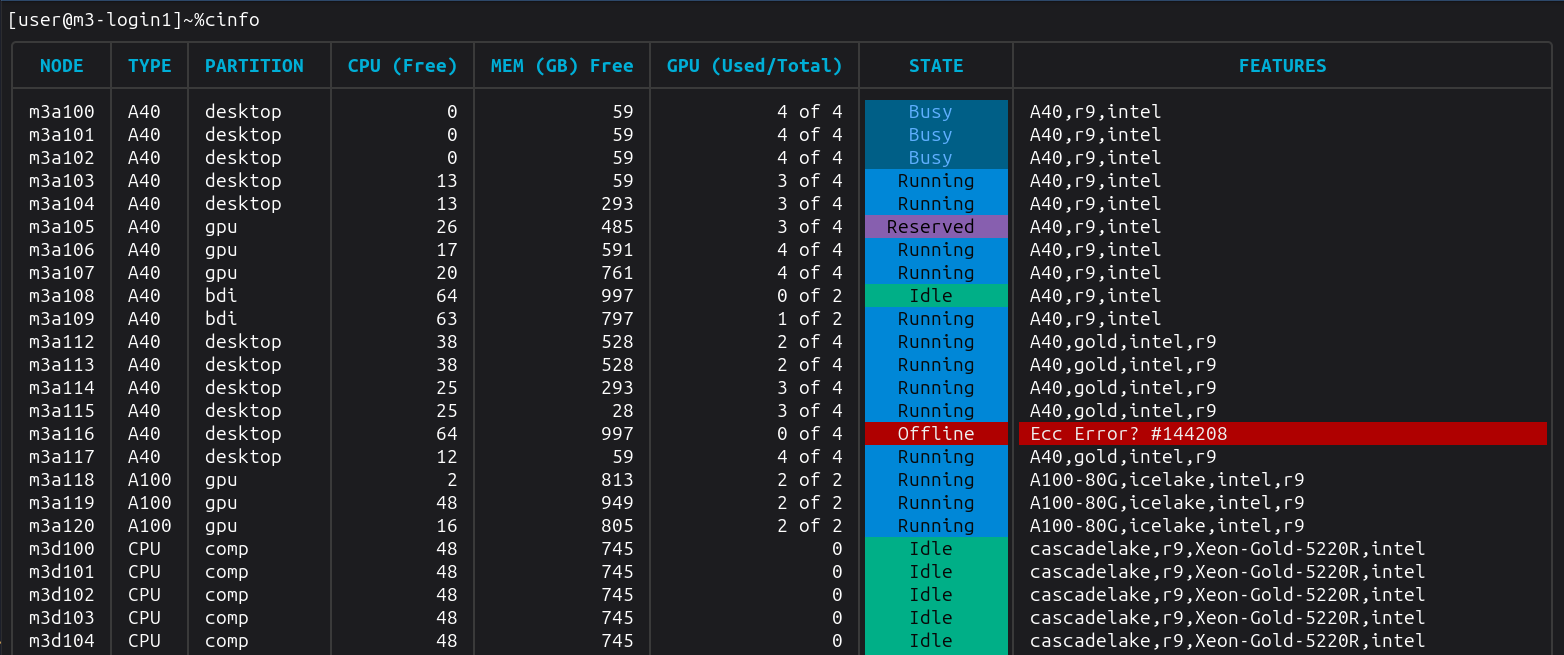
Node Table
Displays one row per cluster node with the following columns:
| Column | Description |
|---|---|
| NODE | Hostname of the node |
| TYPE | Node/GPU type (e.g. a100, or CPU for CPU-only nodes) |
| PARTITION | Slurm partition(s) the node belongs to |
| CPU (Free) | Number of idle CPUs on the node |
| MEM (GB) Free | Free memory in gigabytes |
| GPU (Used/Total) | Used and total GPU count (e.g. 2 of 4) |
| STATE | Current node state, colour-coded (see below) |
| FEATURES / REASON | Active features for healthy nodes; reason for nodes that are Down or Offline |
Node state colours
| State | Meaning |
|---|---|
| Idle | Node is free and available |
| Running | Node is partially allocated (mixed) |
| Busy | Node is fully allocated |
| Reserved | Node is reserved |
| Maintenance | Node is in a maintenance state |
| Down / Offline | Node is down, draining, or not responding |
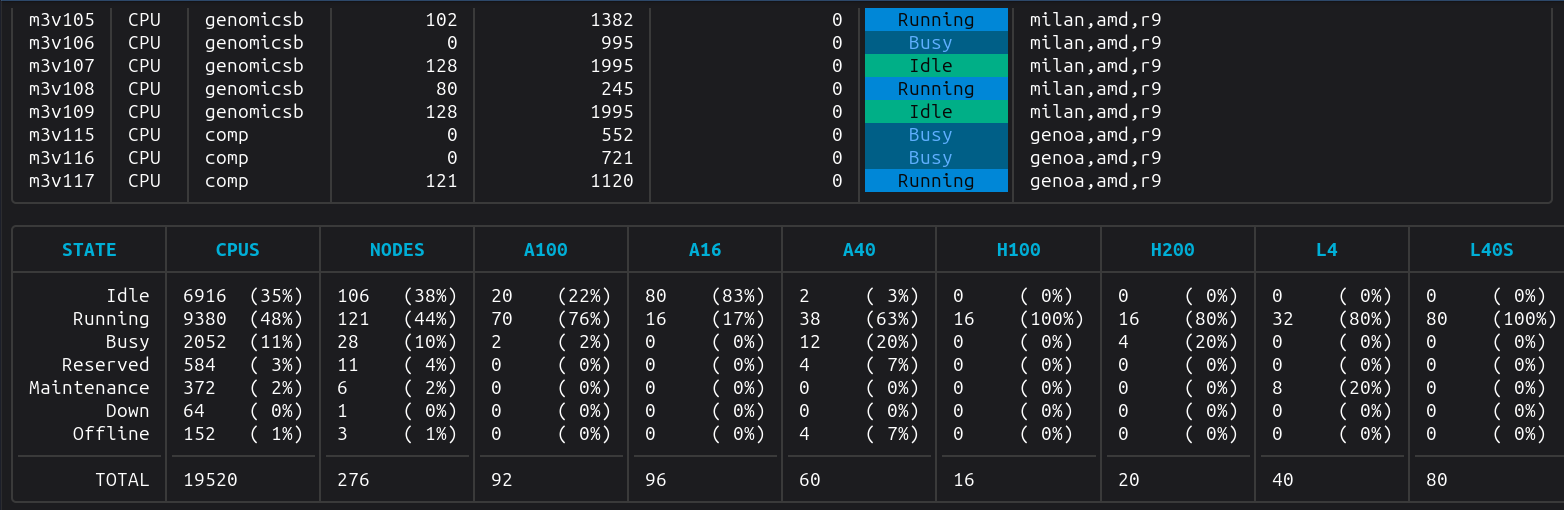
Summary Table
Displays aggregate counts grouped by node status:
| Column | Description |
|---|---|
| STATE | Node state category |
| NODES | Number of nodes in this state |
| CPUS | Total CPU count across nodes in this state |
| (GPU type) | One column per GPU type with total GPU count per state |
A TOTAL row at the bottom sums all columns.
Comparisons to show_cluster
Unlike show_cluster, cinfo does not need to be configured to understand which GPU types we have in the cluster. When showing the cluster summary table, it derives the GPU columns based on the collected node information (taken from scontrol).
Performance
show_cluster seemingly becomes incrementally slower over time. A quick and dirty benchmark script to compare the two implementations:
show_cluster execution benchmark
[user@m3-login1]~/projects/cinfo% ./benchmark.sh show_cluster
Run 1:
  Wall clock : 0.27 s
  RSS        : 26.0 MB
  CPU        : 74%
Run 2:
  Wall clock : 0.29 s
  RSS        : 27.0 MB
  CPU        : 67%
Run 3:
  Wall clock : 0.28 s
  RSS        : 26.0 MB
  CPU        : 71%
Run 4:
  Wall clock : 0.27 s
  RSS        : 25.0 MB
  CPU        : 72%
Run 5:
  Wall clock : 1.29 s
  RSS        : 27.0 MB
  CPU        : 15%
Run 6:
  Wall clock : 3.27 s
  RSS        : 27.0 MB
  CPU        : 6%
Run 7:
  Wall clock : 3.27 s
  RSS        : 27.0 MB
  CPU        : 6%
Run 8:
  Wall clock : 2.27 s
  RSS        : 26.0 MB
  CPU        : 9%
Run 9:
  Wall clock : 3.32 s
  RSS        : 26.0 MB
  CPU        : 6%
Run 10:
  Wall clock : 3.28 s
  RSS        : 26.0 MB
  CPU        : 6%

--- Summary (10 runs) ---

  Wall clock time (s)
    Min: 0.27   Max: 3.32   Avg: 1.781

  Resident set size (MB)
    Min: 25.0   Max: 27.0   Avg: 26.3

  CPU usage (%)
    Min: 6   Max: 74   Avg: 33.200
cinfo execution benchmark
[user@m3-login1]~/projects/cinfo% ./benchmark.sh ./cinfo
Run 1:
  Wall clock : 0.09 s
  RSS        : 18.0 MB
  CPU        : 83%
Run 2:
  Wall clock : 0.09 s
  RSS        : 19.0 MB
  CPU        : 84%
Run 3:
  Wall clock : 0.09 s
  RSS        : 18.0 MB
  CPU        : 86%
Run 4:
  Wall clock : 0.09 s
  RSS        : 18.0 MB
  CPU        : 95%
Run 5:
  Wall clock : 0.08 s
  RSS        : 19.0 MB
  CPU        : 93%
Run 6:
  Wall clock : 0.09 s
  RSS        : 18.0 MB
  CPU        : 91%
Run 7:
  Wall clock : 0.09 s
  RSS        : 17.0 MB
  CPU        : 93%
Run 8:
  Wall clock : 0.09 s
  RSS        : 19.0 MB
  CPU        : 87%
Run 9:
  Wall clock : 0.08 s
  RSS        : 17.0 MB
  CPU        : 89%
Run 10:
  Wall clock : 0.09 s
  RSS        : 19.0 MB
  CPU        : 89%

--- Summary (10 runs) ---

  Wall clock time (s)
    Min: 0.08   Max: 0.09   Avg: .088

  Resident set size (MB)
    Min: 17.0   Max: 19.0   Avg: 18.2

  CPU usage (%)
    Min: 83   Max: 95   Avg: 89.000
Results
cinfo appears to execute much faster and is more efficient on memory.
| Tool | Wall time (s) | Memory (MB) | CPU (%) |
|---|---|---|---|
show_cluster | Min: 0.27 Max: 3.32 Avg: 1.781 | Min: 25.0 Max: 27.0 Avg: 26.3 | Min: 6 Max: 74 Avg: 33.200 |
cinfo | Min: 0.08 Max: 0.09 Avg: 0.088 | Min: 17.0 Max: 19.0 Avg: 18.2 | Min: 83 Max: 95 Avg: 89.000 |